Digital Transformation
Top 10 AI tools for App Analytics
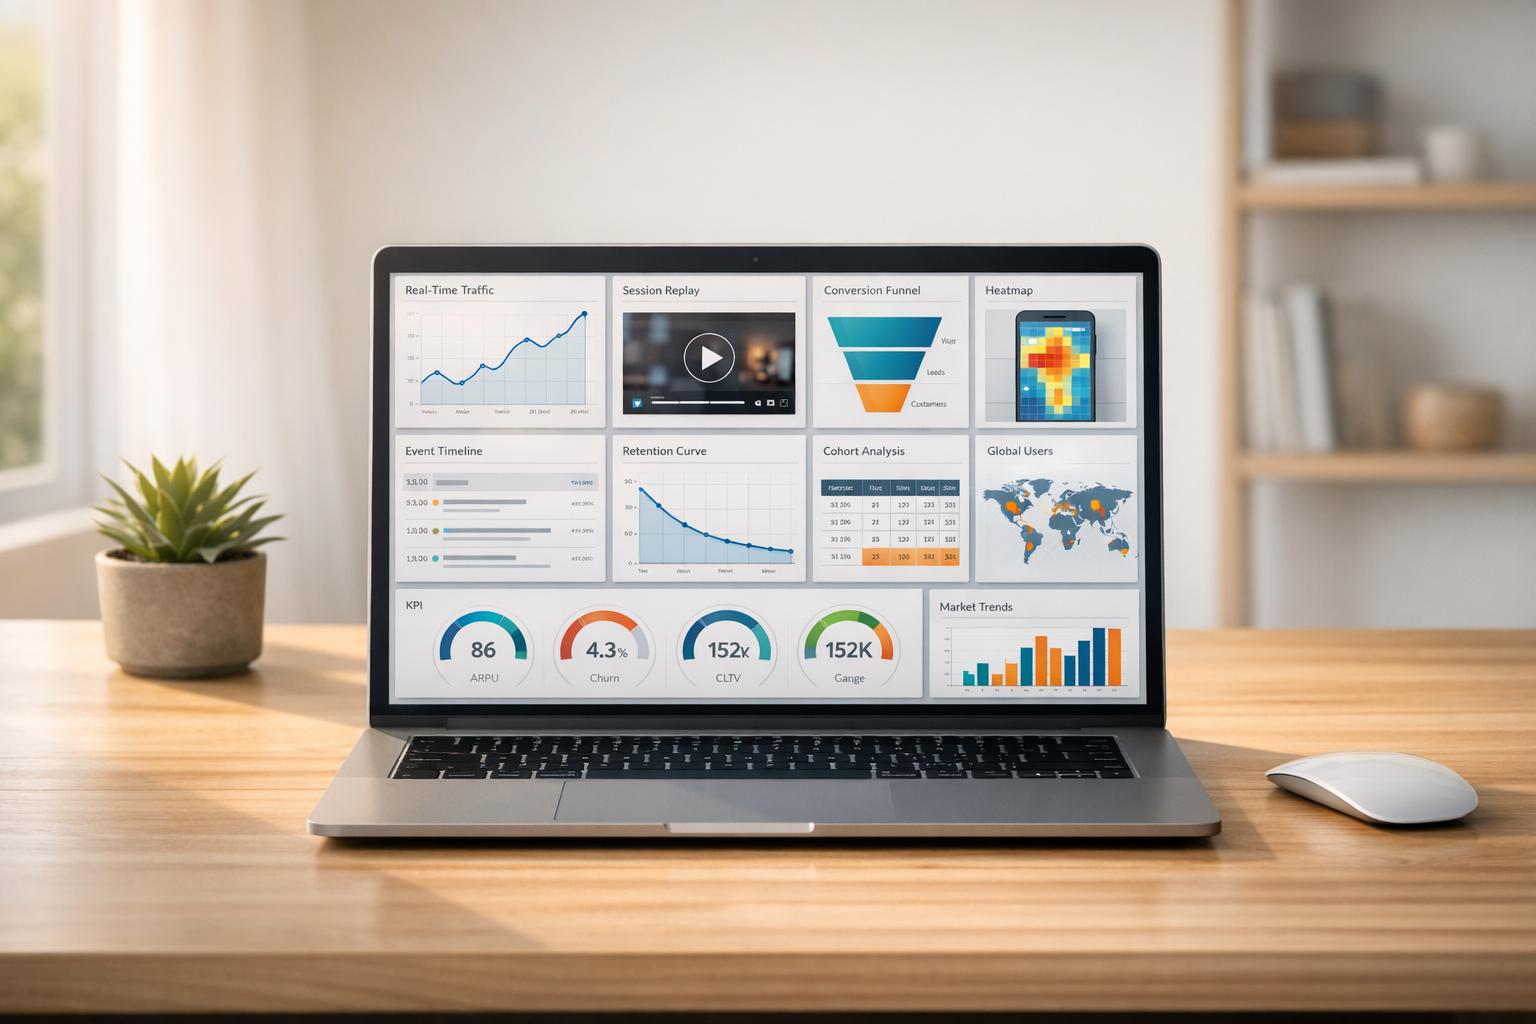
Overview of 10 AI-powered app analytics tools for real-time insights, session replay, event tracking, and market intelligence to boost retention and growth.
Top 10 AI tools for App Analytics
App analytics has moved beyond basic metrics. Today, AI tools help you not only track user behavior but also understand the "why" behind it. This is especially important in a privacy-conscious world where traditional tracking methods are less effective. Here’s a quick look at the top 10 AI tools for app analytics that can help you make smarter decisions:
- Fload.com: Real-time insights, customizable dashboards, and multi-platform integration. Pricing starts at $99/month.
- Kubit: Warehouse-centric analytics with plain-English queries. Scales easily for large apps.
- Smartlook: Always-on session recordings and crash analysis. Free plan available.
- data.ai Intelligence: Market insights and competitor tracking with advanced metrics.
- APPrise: Focuses on performance analytics, though details are limited.
- 1Analytics: Limited public information but offers direct engagement for specifics.
- Mixpanel: Event-based tracking with AI-powered dashboards. Free for up to 1M events/month.
- Amplitude: Predictive analytics and real-time dashboards for retention-focused teams.
- Firebase Analytics: Google-backed, free analytics with real-time event tracking.
- Heap Analytics: Auto-captures every user interaction, requiring minimal setup.
Each tool offers unique features tailored to different needs, from startups to enterprise-level apps. Whether you’re optimizing onboarding flows or tracking user retention, these tools can save you time and improve results. Let’s dive into the details.
1. Fload.com
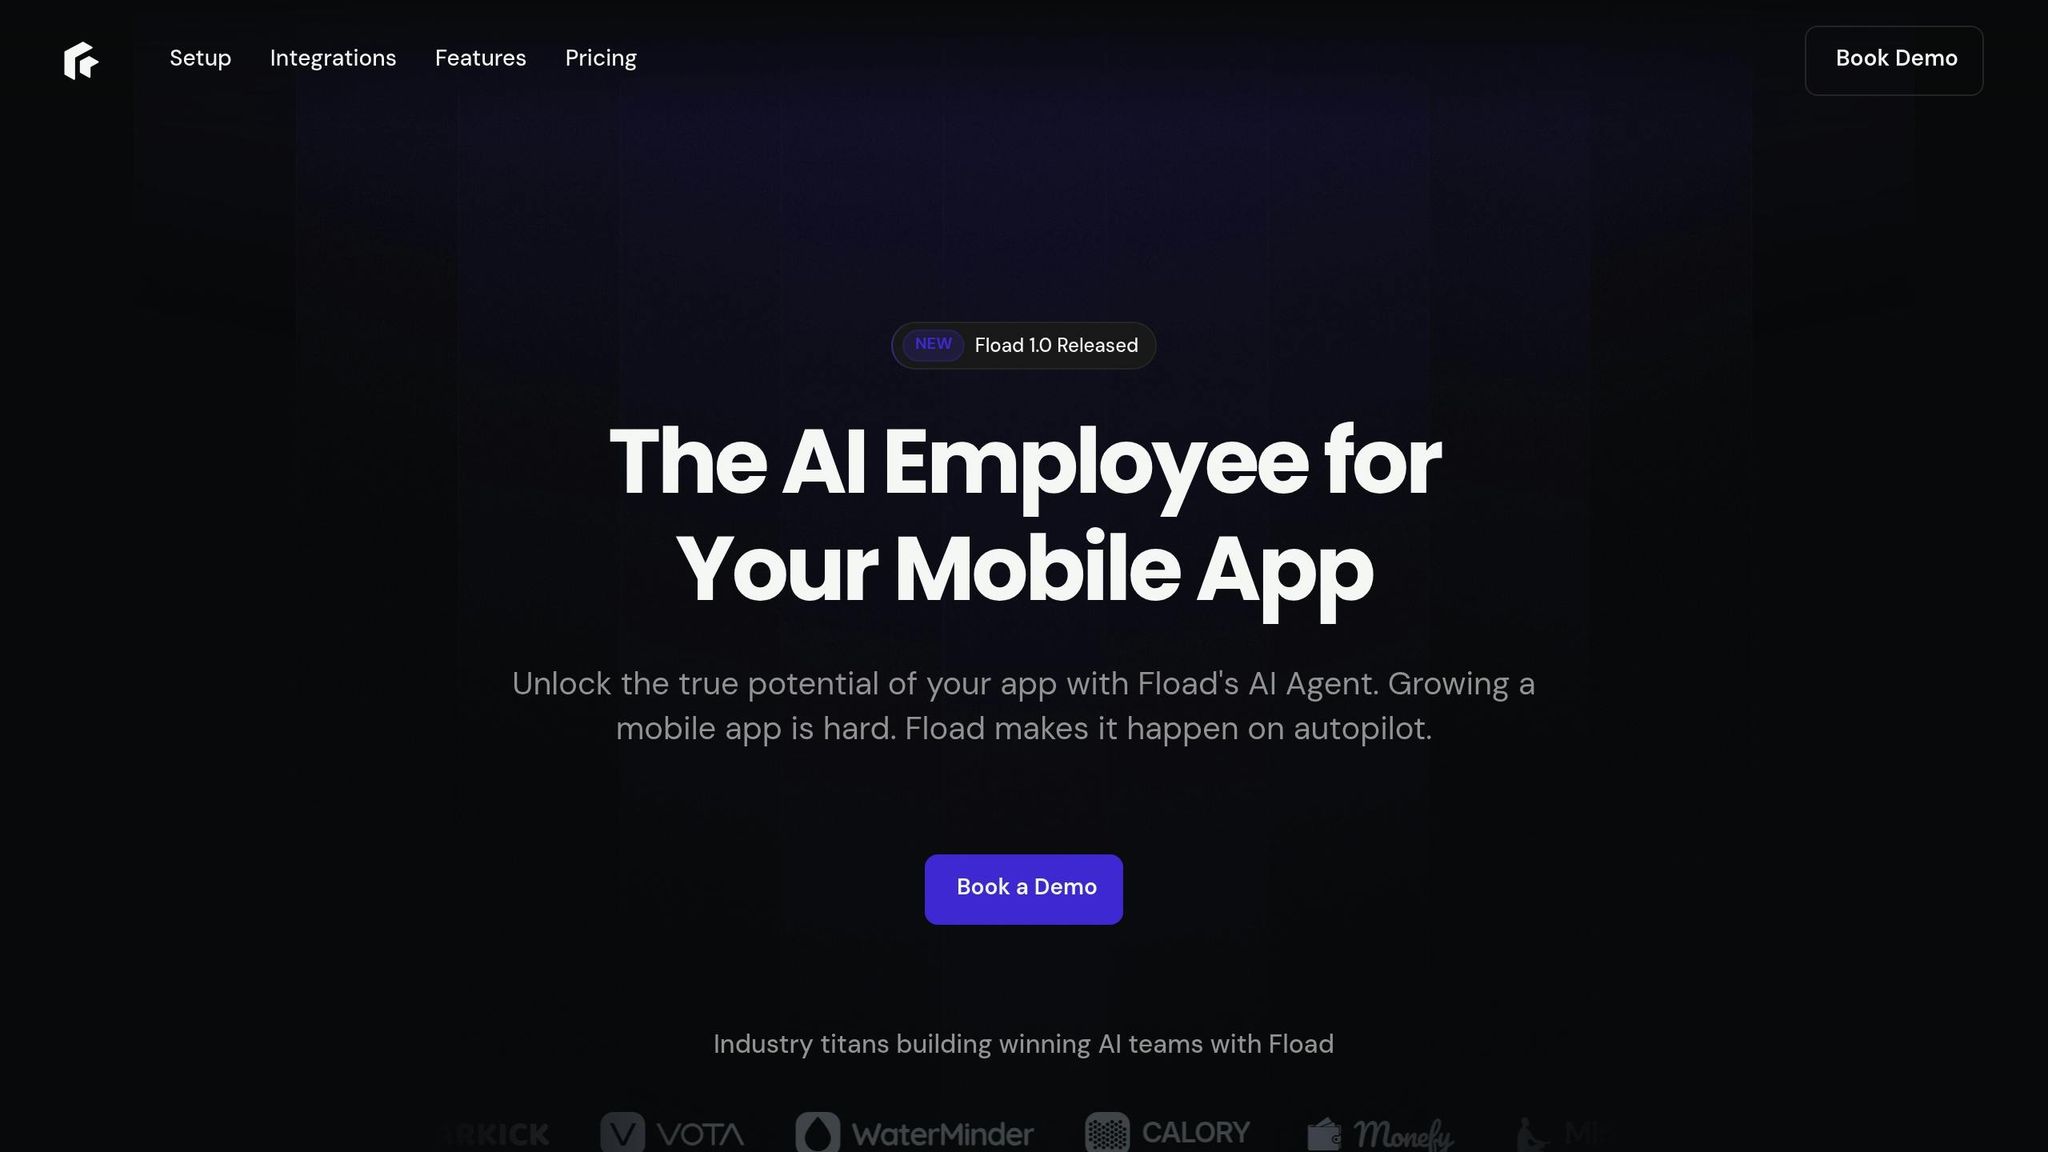
Fload.com stands out as a leading AI tool for app analytics, offering real-time insights and simplified reporting. Think of it as your personal app analyst, always ready to answer questions like, "Why did revenue drop last week?" It processes complex data instantly, helping you make quicker decisions.
Real-time Data Insights
Fload monitors essential metrics - revenue, downloads, reviews, and crash rates - across iOS, Android, and web platforms. It identifies major changes before you even notice them. Herbert Bay, Co-Founder of Earkick, shared:
"Fload's monitoring and alerts have become indispensable. It flags shifts in revenue or engagement before I even notice them. It feels like having an always-on analyst watching our back."
Customizable Dashboards and Reporting
With Fload, you can build tailored dashboards for metrics like ARPU, retention, and engagement in under a minute - no coding required. Toby Sola, Founder of Brightmind, explained:
"I used to juggle a dozen tools just to understand a download spike. Fload gives me instant, accurate answers through one simple AI chat. It even diagnosed my ASO issues in seconds and told me how to fix them."
Integration with Popular Platforms and Tools
Fload connects seamlessly with platforms like App Store Connect, Google Play Console, Stripe, and Facebook Ads. It pulls data from 10–15 sources in under 30 seconds and can send actionable insights straight to Slack or Microsoft Teams.
Scalable for Growing Apps
Whether your app has 100 users or over 100,000, Fload grows with you. Pricing is straightforward, ranging from $99 to $500 per month, with a free plan available for smaller apps.
sbb-itb-212c9ea
2. Kubit
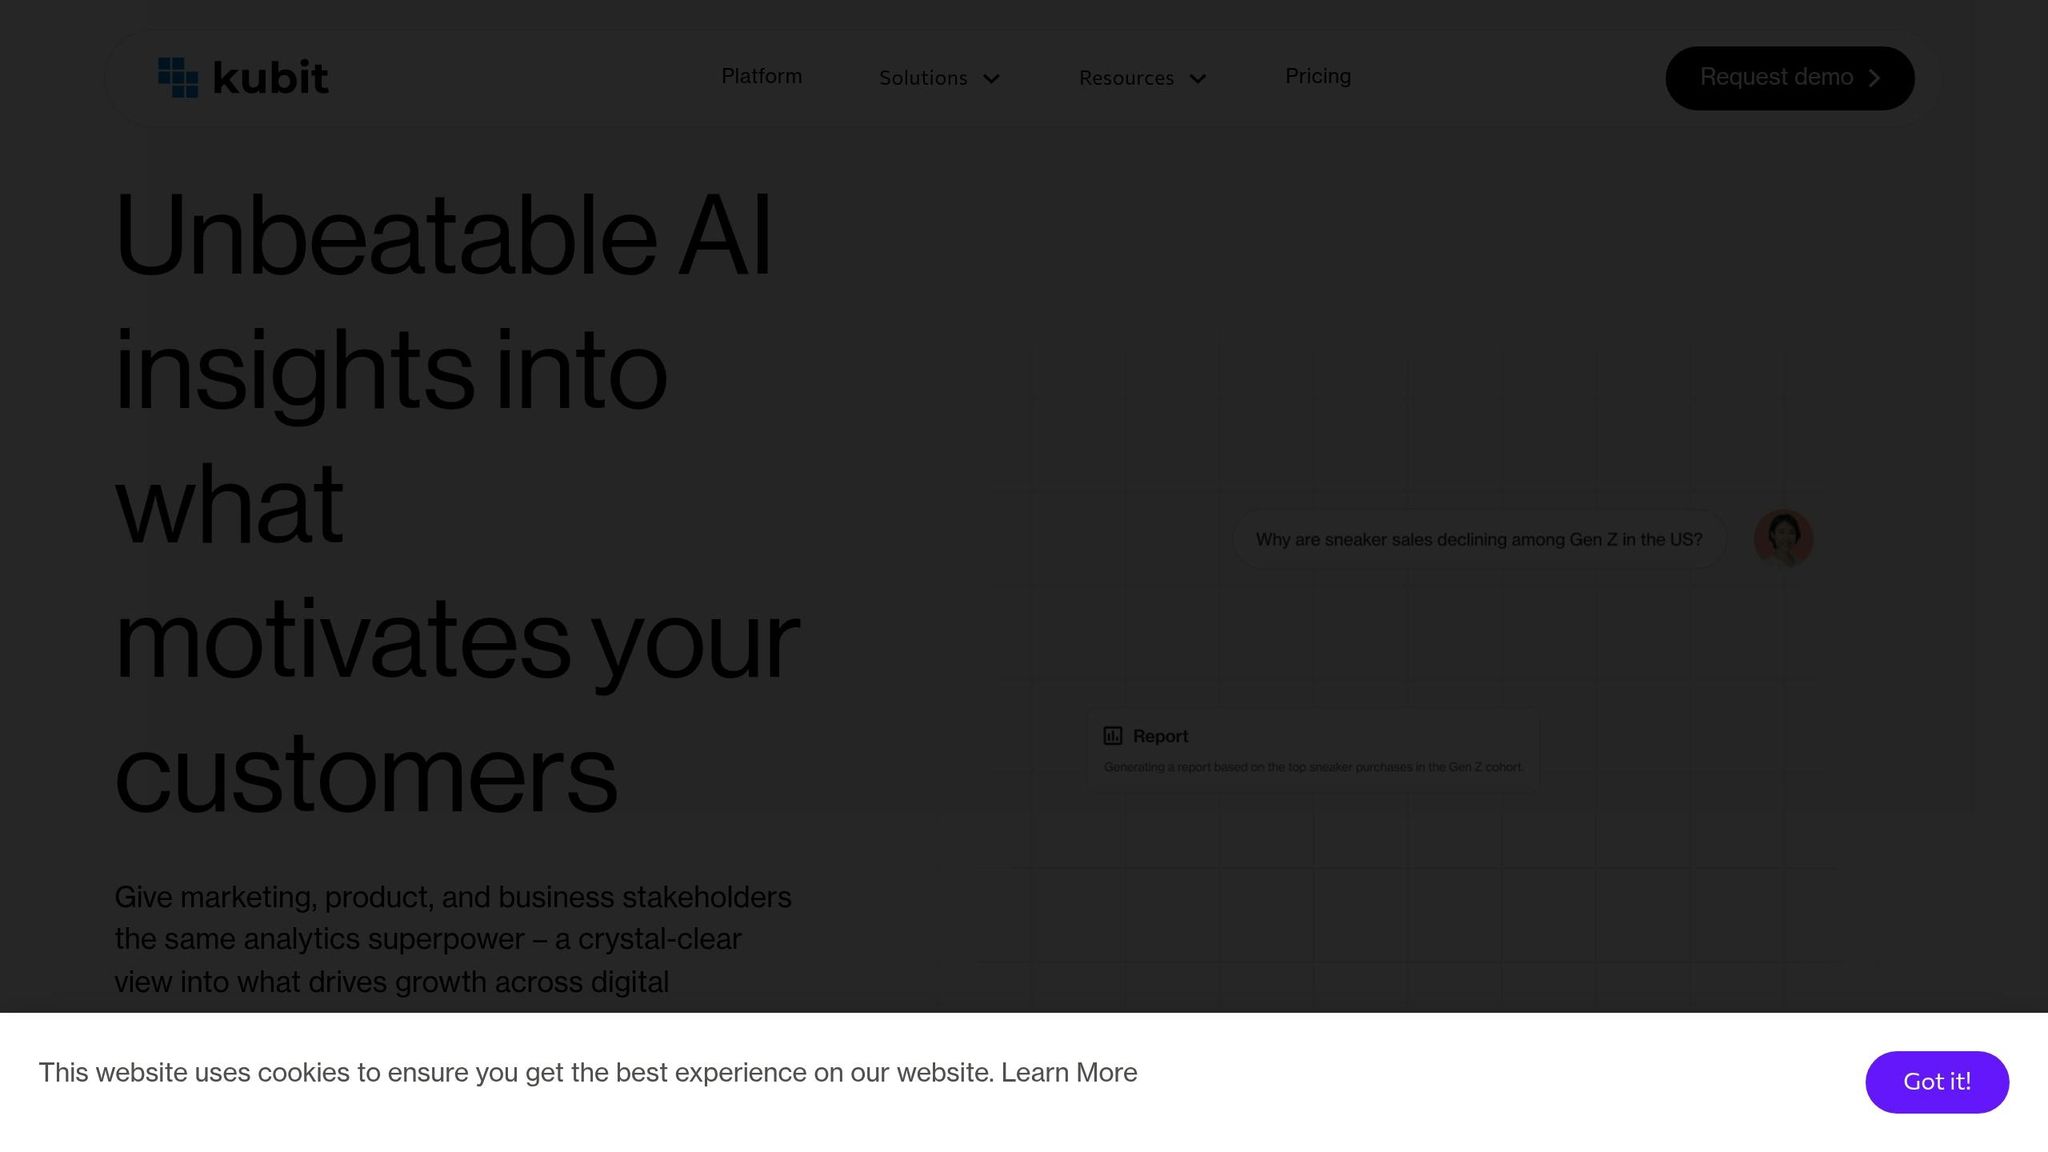
Kubit takes app analytics to the next level by integrating directly with cloud data warehouses like Snowflake, Redshift, BigQuery, and Databricks. This warehouse-centric approach enables it to process live data, delivering insights based on the most up-to-date information. It builds on Fload.com's dashboard capabilities, offering a faster and more seamless way to make data-driven decisions.
Real-time Data Insights
Kubit uses autonomous AI agents to monitor your app's metrics, quickly identifying unusual patterns and uncovering their causes. What once took weeks to investigate can now be resolved in hours. For example, when TelevisaUnivision launched its ViX streaming platform, Senior Product Analyst Isabella Poleo relied on Kubit to track real-time engagement metrics like minutes watched and streaming hours. This allowed the team to make immediate adjustments to features based on actual user behavior.
Customizable Dashboards and Reporting
Kubit simplifies data analysis with its "Ask Kubit" feature, which lets users query data in plain English. It generates verified charts and insights instantly, even for those without SQL expertise. Plus, every insight includes transparent logic, so you can see exactly how it was derived. Felipe Leite, Data Product Manager at Miro, explained:
"Not only are we providing self-service capabilities with Kubit, but it's also a better experience for our Data Analysts. They now have much faster turnaround times."
This self-service model significantly reduces ad hoc requests - by as much as 80% - allowing analysts to focus on more strategic tasks. These capabilities integrate seamlessly with Kubit’s broader platform features.
Integration with Popular Platforms and Tools
Kubit works well with a variety of tools across your data stack, such as Snowplow for data capture, Eppo for experimentation, and Braze for marketing automation. It also integrates with customer data platforms like Segment, mParticle, and Rudderstack. Insights can be turned into actionable segments and synced with engagement tools in just one click, ensuring you can act on data immediately.
Scalability for Apps with Large User Bases
Since Kubit processes data directly within your warehouse, it scales effortlessly as your user base grows, maintaining speed and efficiency. For instance, Serko expanded its data visualizations tenfold after adopting Kubit, while Thrive Global cut its time to insights by 95%. Daniel Todd, CEO of Influence Mobile, shared:
"Within a month of onboarding Kubit, we were able to analyze and improve our onboarding flows, increasing ROI by over 30%, which covered the annual cost of the service multiple times over."
3. Smartlook
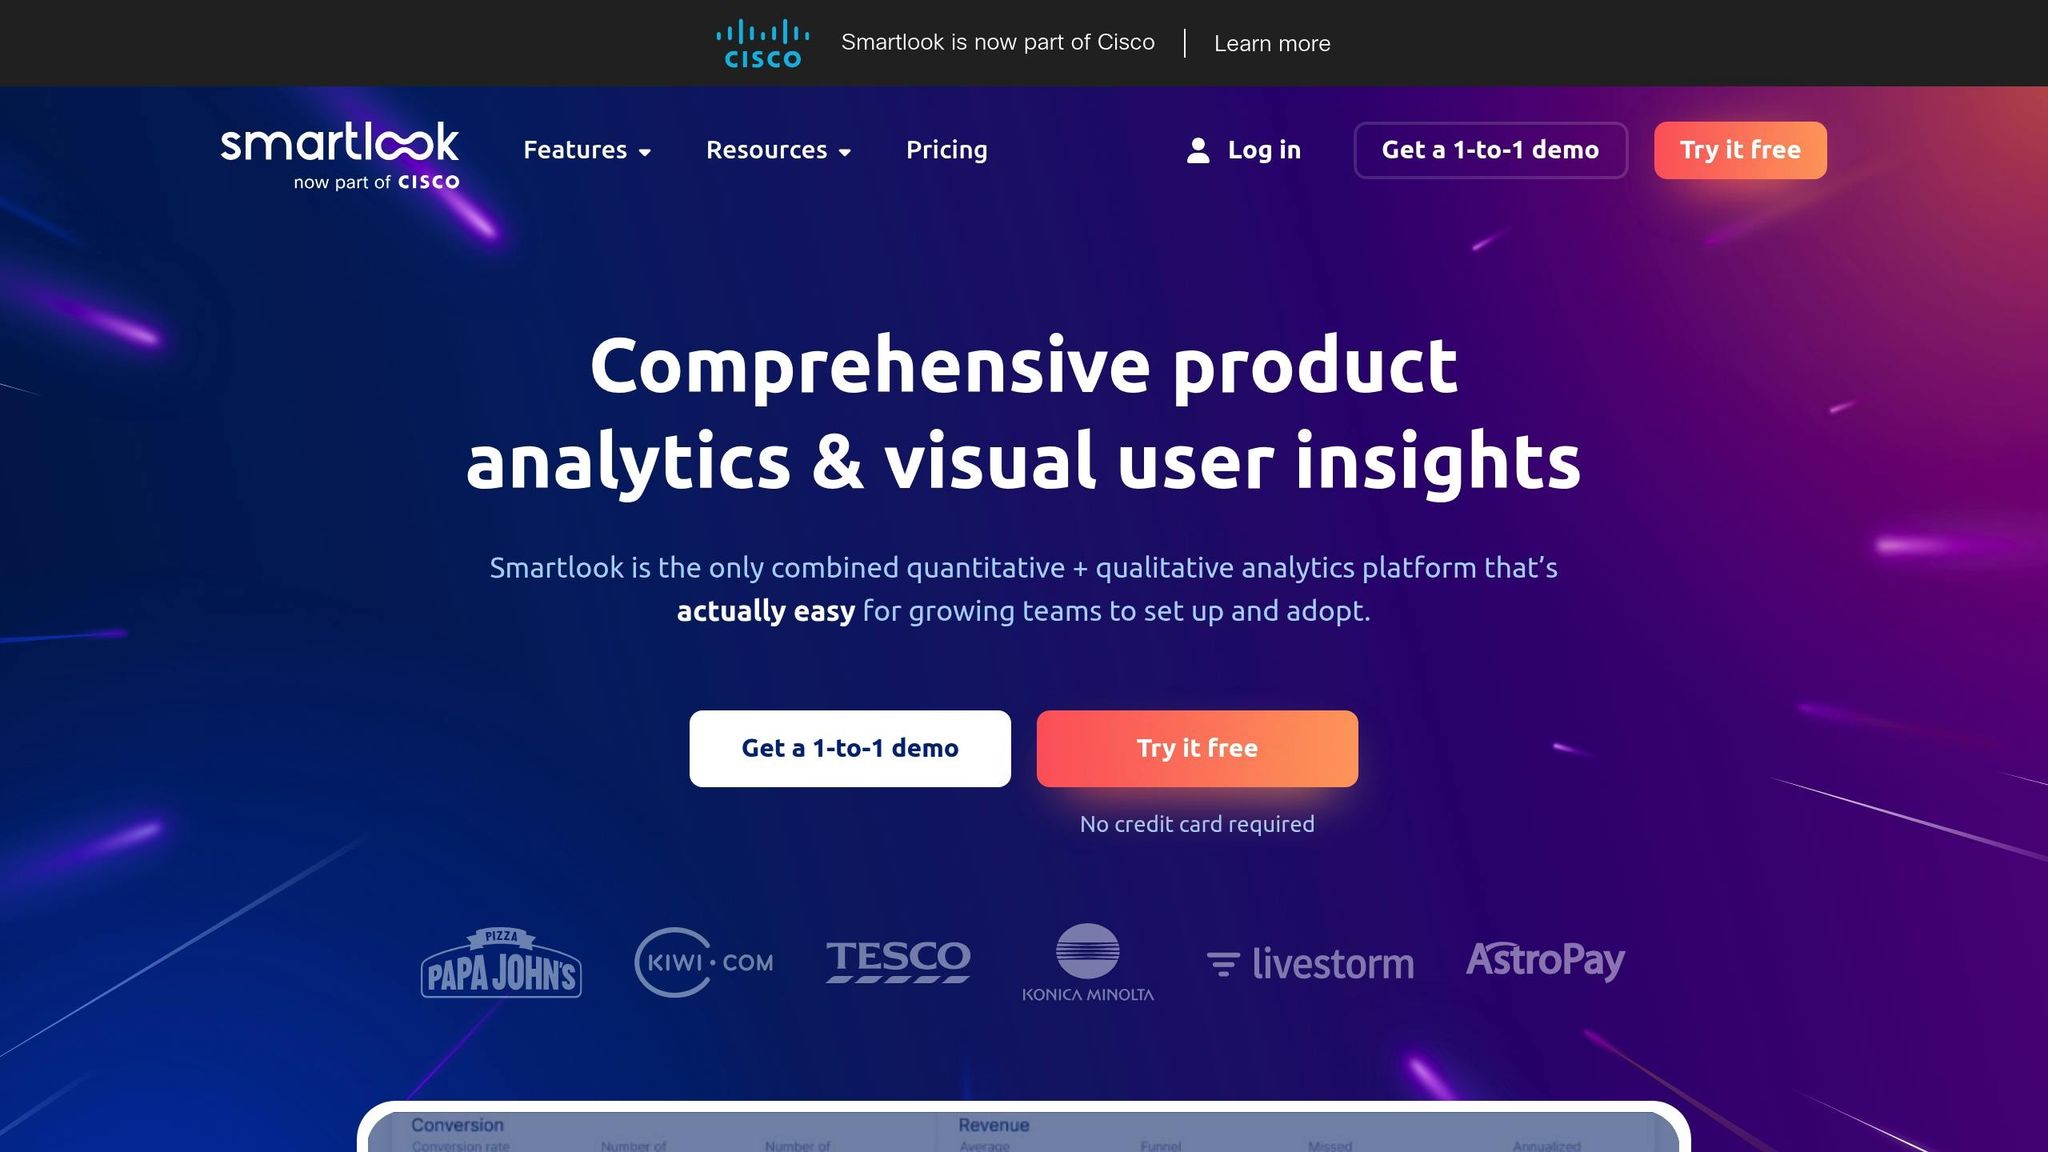
Smartlook takes a unique approach with its "always-on" recording mode, which captures every user interaction - like taps, clicks, and inputs - automatically. This means you can analyze user behavior retroactively without needing to set up manual event tagging in advance. It supports over 10 native mobile platforms and frameworks, including game engines like Unity and Unreal Engine, making it versatile for different development needs. This continuous recording feature is particularly useful for debugging and analyzing performance issues as they happen.
Real-time Data Insights
Smartlook pairs crash reports with session recordings, allowing you to review the moments leading up to a crash. This eliminates the need to manually reproduce bugs, saving time and effort. Its Identify API is another standout feature, enabling customer support teams to watch a user's current or recent session in real time. This makes troubleshooting faster and more effective. For apps with large user bases, Smartlook also offers a wireframe mode. This mode replaces detailed UI elements with abstract representations, reducing CPU and battery usage while protecting sensitive user data.
Customizable Dashboards and Reporting
Smartlook provides 30 filters, such as session duration, country, and device type, to help you tailor your data views. You can also build custom funnels by linking multiple events to visualize specific user journeys and calculate conversion rates between key steps. A great example of this is AstroPay, which used these features to analyze its cryptocurrency purchase process. After identifying a high drop-off point caused by confusion over pending transactions, they added a "Purchase pending" banner and local currency options. This change resulted in a 56% boost in conversion rates.
Integration with Popular Platforms and Tools
Beyond its recording capabilities, Smartlook integrates seamlessly with well-known analytics and productivity tools. It connects with platforms like Firebase, Mixpanel, Amplitude, and Heap for analytics, as well as Slack, Jira, Sentry, and Zapier for productivity. For example, you can attach session replays directly to technical tickets in Jira or Sentry, giving developers a clear view of the actions that led to a crash. Hazal Bulut, a Quality Assurance Tester at Vertigo Games, shared her experience:
"Smartlook offers many advanced features. For example, thanks to your API, we can easily access and monitor in-game behaviors. And Smartlook's stable SDK in terms of development are real time-savers."
Scalability for Apps with Large User Bases
Smartlook's SDK is designed to minimize its impact on app performance and battery usage, even as your user base grows. The platform also lets you adjust recording quality across three levels, with adaptive frame rates to balance detail and performance needs. Pricing starts with a free plan that supports up to 3,000 user sessions per month, while paid plans begin at $55/month for 5,000 sessions per month. Petr Bláha, Founder and CEO of Disivo, highlighted the platform's value:
"When I think about how much of developers' time I am saving with Smartlook, I am easily around 300-400% ROI."
4. data.ai Intelligence
data.ai Intelligence, now part of Sensor Tower as of March 2024, provides detailed market insights that simplify complex data. It tracks downloads, revenue, and engagement metrics for iOS and Android apps across 150+ countries, covering over 8 million apps and numerous websites. This tool is trusted by major players like Google, Snapchat, United Airlines, Activision, Visa, and Samsung to refine their mobile strategies. Let’s dive into how data.ai Intelligence transforms raw numbers into meaningful insights.
Real-time Data Insights
With tools like the Compare Apps Report and Insights Generator, users can evaluate monetization, user retention, and growth trends. The Keyword Defense feature helps monitor organic keywords that may be at risk from paid search competition, while the IAP SKU feature highlights top-performing in-app purchases across various markets.
Customizable Dashboards and Reporting
data.ai offers flexibility with its free ConnectPlus tier, which consolidates data from over 50 sources, and a premium Intelligence tier that adds advanced metrics like SDK insights, cross-app usage patterns, and advertising share-of-voice data. Ted Krantz, CEO of data.ai, emphasizes this vision:
"Today we are the mobile standard which is the tip of the spear and where the market is going. However, we see a blue ocean opportunity to assemble a wider variety of digital datasets and activate artificial intelligence so that enterprises can compete at a higher level."
Integration with Popular Platforms and Tools
The platform integrates seamlessly with over 400 ad partners and store connections through Ascend and ConnectPlus, linking with major ad platforms and technical tools. It also supports automatic data extraction into business intelligence tools like Google Looker Studio.
Scalability for Apps with Large User Bases
In 2025, a new data pipeline was introduced, combining panel and model data to provide more reliable estimates. Ramesh Venugopal, a Sensor Tower Board of Directors member, commented on the platform’s robust data approach:
"The combined company becomes the gold standard for how first party data from publishers, and data from consumer facing utility applications, can be integrated under a unique differential privacy framework."
The App IQ feature offers taxonomy-based insights across 19 genres and 152 subgenres, ensuring in-depth analysis. Premium pricing depends on the geographic scope, data depth, and number of user seats.
5. APPrise
APPrise centers on app performance analytics, providing tools to track performance and user behavior. However, there isn't much publicly available information detailing its specific features. Key aspects like real-time data processing and integration options remain unclear.
For a thorough understanding of what APPrise offers, it's best to explore their official resources.
6. 1Analytics
Finding detailed information about 1Analytics can be tricky, as there’s limited public data available on its features, pricing, or technical specifics. Key aspects like real-time analytics, customizable dashboards, data integration, or scalability remain unconfirmed.
To get a clearer picture, it’s best to reach out to 1Analytics directly. Requesting a demo, case studies, or technical documentation can help you determine if it fits your app analytics requirements. The lack of public documentation might simply reflect a preference for direct, personalized engagement with potential users.
Let’s move on to the next tool.
7. Mixpanel
Mixpanel provides real-time user data without delays, making it easier for teams to identify and address issues quickly after a new release. It tracks key activation and retention metrics, helping you understand how users interact with your app and where they disengage. With features like real-time event tracking and funnel segmentation, Mixpanel offers a clear view of user behavior.
Real-time Data Insights
Mixpanel’s no-code tracking tools allow even non-technical teams to monitor app performance effortlessly. Its "AI for Analytics" dashboard templates make it possible to start analyzing data within minutes. According to reports, customers have seen an average 19% increase in Monthly Active Users (MAU). For example, Huntr managed to cut the time spent analyzing user behavior by 70%.
"Mixpanel is the 'intuition pump' for our product team. It enables our product managers and designers to uncover and focus on larger opportunities for product discovery and improvement." – Angela Sun, Sr. Product Manager
Customizable Dashboards and Reporting
Mixpanel offers pre-built dashboard templates tailored for various needs, including AI analytics, KPIs, cohort analysis, and marketing. Its advanced reporting features, like retention and insight reports, help link user growth metrics to revenue. The "Metric Trees" feature provides a visual representation of how different metrics contribute to overarching business goals. Plus, the Autocapture function simplifies the process of tracking app metrics and building dashboards, eliminating the need for heavy engineering input.
Integration with Popular Platforms and Tools
Mixpanel seamlessly integrates with over 100 marketing and data tools. It connects with cloud data warehouses like BigQuery, Snowflake, and Redshift, and works with customer data platforms such as Segment, mParticle, and Rudderstack for unified user data. For mobile apps, Mixpanel’s native SDKs for iOS and Android include attribution data directly in product analytics. Marketing teams can also use tools like Mailchimp, Marketo, and Customer.io to trigger personalized campaigns.
Scalability for Apps with Large User Bases
Designed to handle large-scale operations, Mixpanel delivers lightning-fast query times, even when processing billions of monthly events. For instance, its partner integration with Apxor can handle up to 10 billion events per month. The Starter plan offers 1 million monthly events for free, while the Growth plan starts at $779 per year, with extra events priced at $0.28 per 1,000 events. Enterprise pricing adjusts based on data volume and can reach around $200,000 annually for extensive deployments. Mixpanel is highly rated, earning 4.6/5 on G2 and 4.5/5 on Capterra.
8. Amplitude
Amplitude stands out for its AI-driven analytics, designed to deliver actionable insights quickly and efficiently. With a backend architecture focused on minimizing latency, developers can view user actions in real-time dashboards within seconds. This immediacy allows teams to identify and address issues without delay, ensuring smooth operations and improved user experiences. Among its standout features are the Event Explorer, which provides live event streams, and AI Agents that monitor metrics to detect anomalies and suggest optimizations.
Real-time Data Insights
Amplitude's dashboards provide continuous tracking of metrics like active users, session lengths, and bounce rates as data flows in. Meanwhile, its AI Agents analyze patterns to flag potential issues before they escalate, enabling teams to focus on creating new features rather than spending time troubleshooting.
Customizable Dashboards and Reporting
Amplitude offers highly customizable dashboards that combine saved charts, behavioral cohorts, session replays, and even multimedia content from platforms like Loom, Vimeo, Zoom, and YouTube. The built-in Dashboard Agent allows users to tailor insights by giving specific instructions, such as focusing on onboarding drop-offs or highlighting mobile user behavior. Enterprise users can mark dashboards as "official" to serve as reliable references, while Starter plan users have a limit of 50 dashboard subscriptions. This flexibility aligns seamlessly with Amplitude's extensive integration network.
Integration with Popular Platforms and Tools
Amplitude integrates easily with over 150 pre-built tools, eliminating the need for custom pipelines. Its warehouse-native capabilities allow teams to analyze data directly within systems like Snowflake, BigQuery, and Databricks. Additionally, the platform supports bidirectional integrations, enabling it to ingest data from ad networks and attribution tools while syncing behavioral cohorts with downstream platforms like Braze or Userlist.
"I sold the philosophy internally for a new way to do product. … We quickly realized there is only one tool that works for this, and it's Amplitude." – Damien Delautier, Chief Product Officer, Groupe Canal+
Amplitude has delivered measurable results for many organizations. For example, Cliff Kim, VP of Data and Analytics, used Amplitude's reports to uncover hidden user behavior issues, resulting in a 27% increase in conversions and immediate revenue gains. Similarly, Principal Product Manager David Gao leveraged personalized insights to boost new subscriber counts by 40%. A commissioned study also revealed that the platform achieved a 217% return on investment (ROI) over three years.
Scalability for Apps with Large User Bases
Amplitude's capabilities extend to supporting large-scale digital products. With over 11,000 digital products relying on its platform and 156 integration results available, Amplitude is built to handle massive data volumes. Its warehouse-native architecture processes queries directly where the data resides, eliminating bottlenecks and maintaining high performance, even as user demands grow. This scalability makes it an ideal choice for businesses with extensive user bases.
9. Firebase Analytics
Firebase Analytics, part of Google's suite of tools, offers a powerful and completely free analytics solution tailored for mobile apps. It allows developers to track up to 500 unique events with unlimited reporting capabilities. Unlike traditional analytics that rely on session-based data, Firebase adopts an event-focused approach, capturing every significant interaction - like app_open or add_to_cart - to provide detailed insights into user behavior. The SDK simplifies setup by automatically logging dozens of key events and user properties, requiring little to no additional coding.
Real-time Data Insights
One of Firebase's standout features is its real-time monitoring. Tools like StreamView provide live event tracking, offering instant visibility into how features are performing, where users are located down to the city level, and how user properties are distributed. Meanwhile, DebugView helps developers validate their analytics setup by showing event streams from development devices, ensuring everything works as intended before the app goes live. These real-time capabilities eliminate the common delays seen in other platforms, which often take hours to process data.
"When it comes to analytics, the sooner you can see your data, the quicker you can react to it, and the more valuable it can be." - Steve Ganem, Product Manager, Firebase
Several success stories highlight the platform’s potential. For example, Pomelo Games, a gaming studio in Uruguay, combined Firebase Analytics with Remote Config and A/B Testing to optimize interstitial ads. This strategy boosted their revenue by up to 35% without harming retention or app performance. Similarly, KCB Group, a bank in East Africa, used Firebase Analytics to analyze customer behavior across acquisition channels. By optimizing their top-performing channels, they managed to cut their cost per install by 24%.
Integration with Popular Platforms and Tools
Firebase Analytics offers seamless integration with a variety of tools, including BigQuery, Crashlytics, Firebase Cloud Messaging, Remote Config, Google Tag Manager, Google Ads, AdMob, and Looker Studio. One particularly useful feature is its Real-time BigQuery Export, which streams event data directly into BigQuery for advanced analysis or live dashboards in Looker Studio. Additionally, custom audiences created in Firebase Analytics can be paired with Remote Config to adjust the app's look or functionality for specific user groups, all without requiring an app update. For developers planning to conduct in-depth analysis or merge app data with broader business datasets, linking Firebase to BigQuery early on is a smart move.
10. Heap Analytics
Heap Analytics stands out with its autocapture technology, which tracks every user interaction - clicks, swipes, and page views - across web and mobile platforms without requiring manual tagging. Its single SDK collects all interactions, making it a go-to solution for over 10,000 companies looking to understand customer journeys. One of its most powerful features is data virtualization, which allows you to define, rename, or group events retroactively while preserving historical data. This means you can analyze past user behavior even for events you define today. Heap also provides immediate insights and customizable reports to help teams make informed decisions.
Real-time Data Insights
Heap’s Live Data Feed lets you monitor user interactions as they happen, while its AI assistant, CoPilot (Sense), simplifies queries like "Where are users dropping off?" and delivers summarized charts in seconds. The "Mobile App Overview" dashboard template offers a snapshot of mobile app user activity, often within hours of installation. For instance, PocketSuite reduced paid user churn by 30% after adopting Heap for product analytics.
"The sticking point with Amplitude is the never-ending battle between product and engineering. With Heap, it's just a half-day for an engineer to install, and then I can answer my questions from that point by myself." - Lane Zimmerman, Product Manager
Customizable Dashboards and Reporting
Heap offers a mix of pre-built dashboard templates and a powerful custom query builder, enabling users to create charts, graphs, and performance cards tailored to specific events or user behaviors. Its AI-driven Sense feature even names and describes visualizations automatically, making it easier to share findings with your team. Automated alerts for critical metrics can be configured to notify you via Slack or email when significant changes occur. Companies using Heap have reported impressive results, such as a 30% boost in conversions, while one enterprise client saved $225,000 monthly by leveraging its insights.
Integration with Popular Platforms and Tools
Heap integrates with over 100 tools, including those for A/B testing, CRM, marketing automation, and data warehousing. Its ETL-managed Heap Connect feature allows seamless syncing of behavioral data into platforms like Snowflake, BigQuery, or Redshift for advanced analysis. The platform also connects with Salesforce, HubSpot, Braze, and Klaviyo, enabling teams to combine account-level data with behavioral insights for more personalized outreach. For e-commerce businesses, Heap’s native Shopify integration simplifies tracking metrics like product views and purchases. Additionally, it supports all major mobile frameworks, including iOS (UIKit and SwiftUI), Android (View and Jetpack Compose), React Native, Flutter, and Capacitor.
Feature Comparison Table
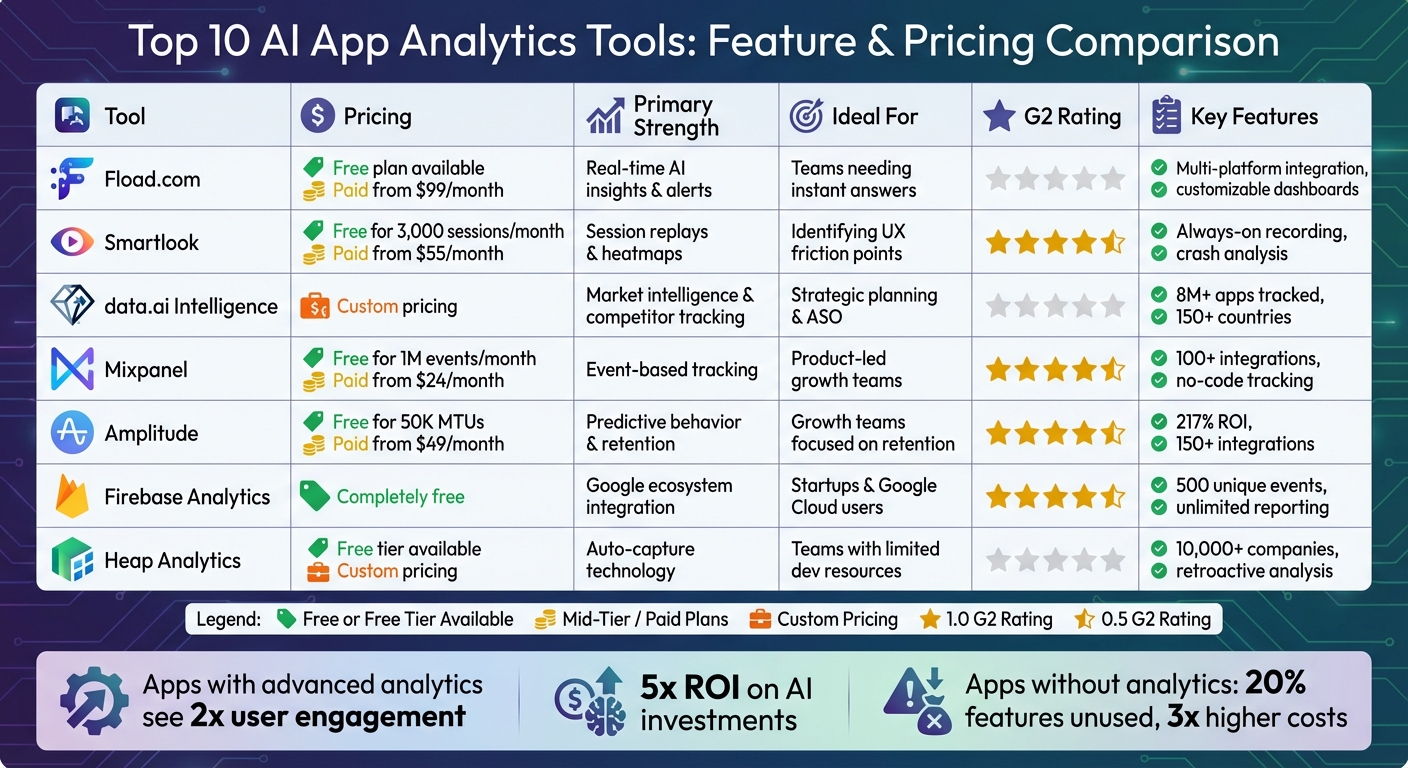
Top 10 AI App Analytics Tools Comparison: Features, Pricing & Ratings
Here’s a comparison of pricing, strengths, and standout features for various tools. Use this table to weigh your options and find the best fit for your team’s goals and budget.
| Tool | Pricing | Primary Strength | Ideal For | G2 Rating |
|---|---|---|---|---|
| Fload.com | Free plan; from $99/month | Real-time AI insights & alerts | Teams needing instant answers | N/A |
| Smartlook | Free for 3,000 sessions/month; from $55/month | Session replays & heatmaps | Identifying UX friction points | 4.5/5 |
| data.ai Intelligence | Custom pricing | Market intelligence & competitor tracking | Strategic planning & ASO | N/A |
| Mixpanel | Free for 1M events/month; from $24/month | Event-based tracking | Product-led growth teams | 4.6/5 |
| Amplitude | Free for 50K MTUs; from $49/month | Predictive behavior & retention | Growth teams focused on retention | 4.5/5 |
| Firebase Analytics | Completely free | Google ecosystem integration | Startups & Google Cloud users | 4.5/5 |
| Heap Analytics | Free tier; custom pricing | Auto-capture technology | Teams with limited dev resources | N/A |
Key Insights
- Mixpanel offers lightning-fast query results, even at scale, making it a reliable choice for teams that handle large datasets.
- Amplitude processes millions of data requests daily and leverages its "Compass" tool to pinpoint behaviors that drive retention.
- Firebase Analytics stands out with unlimited reporting for 500 distinct events, all at no cost.
- Heap Analytics simplifies event tracking with its auto-capture feature, allowing teams to retroactively define and analyze user events - no engineering support required.
Each tool has its strengths, so the right choice depends on your team’s specific needs and resources.
Conclusion
The world of app analytics has evolved, and understanding user behavior is now essential for driving meaningful growth. With AI-powered analytics tools, you can go beyond surface-level metrics like page views to uncover actionable insights that highlight exactly what steps to take next.
Apps that utilize advanced analytics report twice the user engagement and a fivefold return on their AI investments. On the flip side, apps without proper analytics often face challenges like wasting resources - 20% of features unused - and seeing operational costs soar to three times higher than necessary. These tools make data accessible across teams, enabling anyone to ask straightforward questions and receive immediate, practical insights. As Tekla Wannberg from The Mindfulness App shared:
"Fload has transformed how I approach app growth. It surfaces deep insights I'd never dig for, helping me catch issues before they hit."
By leveraging these insights, your app can achieve measurable, sustained growth.
Start by identifying the critical questions your team needs answered - whether it's understanding where users drop off during checkout or predicting churn. Then, craft an analytics stack that combines product metrics with user experience insights. Many platforms offer free tiers, making it easy to test their value before committing to a larger investment.
Take Fload.com, for example - ranked as the top tool in our analysis - along with other standout platforms. These tools shift your strategy from reactive to proactive. Try integrating them into your workflow for 90 days and experience how real-time AI alerts and optimization features can replace guesswork with clarity and confidence.
FAQs
How do I choose the right AI app analytics tool for my team?
To find the best AI app analytics tool, start by defining what you want to achieve. Are you focused on tracking user engagement, mapping out user journeys, or analyzing marketing performance? Once your goals are clear, think about platform compatibility - does the tool work seamlessly with your app? Look for features like real-time data tracking and the ability to customize reports. Don’t forget to consider your budget, too.
When evaluating options, focus on tools that can deliver insights you can act on and that can scale as your app grows. Many tools offer trial versions, which are a great way to test if they align with your app’s performance and growth needs before committing.
Can I use AI analytics while staying privacy-compliant?
Yes, AI analytics can work effectively while staying within privacy regulations. Many tools now offer features like anonymized data collection, cookieless tracking, and user consent mechanisms to meet the requirements of laws like GDPR and CCPA. These methods let developers and marketers gather insights while respecting user privacy, ensuring they adhere to current data protection standards.
What should I track first to improve retention and revenue?
To improve retention and revenue, keep a close eye on user behavior and engagement metrics such as in-app actions, screen views, and purchase events. By analyzing these data points, you can pinpoint where users lose interest and which features encourage spending. Understanding these patterns allows you to make smarter, data-backed decisions for enhancing user experience and boosting monetization.