Polyvia is an AI Business tool. Indexes visual data from documents into a knowledge graph for queryable AI agent insights. Key features include Visual Knowledge Index, Advanced Document Understanding, and VLM-OCR for Contextual Meaning. Best for data scientists and analysts, financial advisors and analysts and business consultants.
About Polyvia
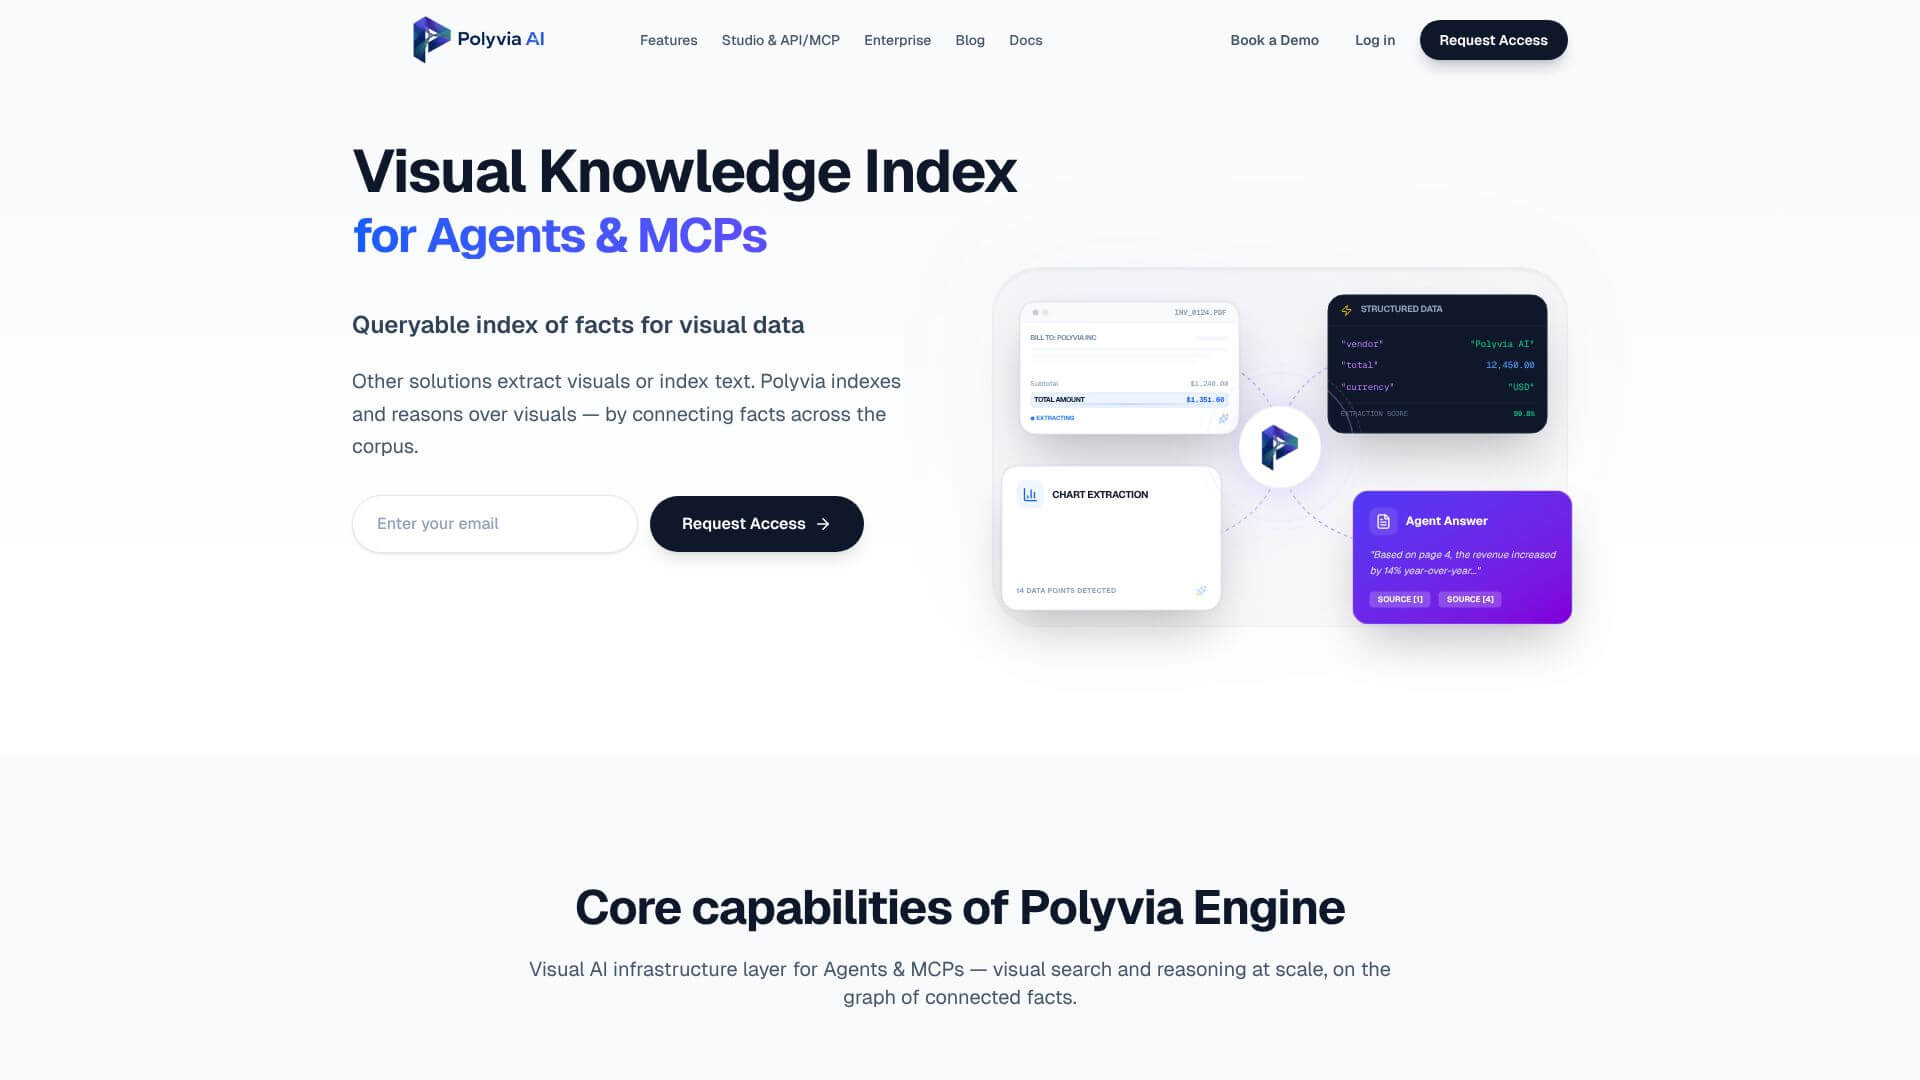
Polyvia is an AI platform that builds a Visual Knowledge Index from documents containing charts, tables, and other visual data. The platform uses Vision-Language Models and OCR to extract not just text but the logical relationships within visuals, creating a queryable knowledge graph that AI agents can reason over. The use case targets enterprise teams handling decision-critical visual data scattered across PDFs and reports.
The core features that matter
- Visual Knowledge Index as the first index purpose-built for agentic AI systems, processing visual data and connecting facts across documents into a unified knowledge graph with full source traceability
- Advanced document understanding acting as visual data infrastructure that bridges unstructured documents with AI agents, addressing the scattered-visuals problem in organizations with many PDFs and reports
- VLM-OCR for contextual meaning using Vision-Language Models alongside OCR to extract not just visual content but logical relationships and meaning, supporting precise extraction like "Q3 revenue increased by 14%" with source citation
- Single source of truth with granular disambiguation organizing every visual fact by company, quarter, source, and page with confidence scores, supporting financial analysis and competitive research where data lineage matters
How it stands out
The document intelligence space has established players (Hebbia, Glean, Notion AI) and newer entrants focused on enterprise search. Polyvia's specific position is the visual-data focus rather than text-first document understanding. Most competitors treat charts and tables as second-class content; Polyvia treats them as primary data sources, which matters more for finance, equity research, and competitive intelligence where the numbers live in visuals rather than prose.
The honest qualifier: visual document understanding accuracy depends on document quality, chart type, and how clearly relationships are visualized. Polyvia handles standard financial reports and structured documents well; for unusual chart types or poorly-scanned source materials, accuracy varies. The confidence scoring helps users interpret reliability rather than treating every extraction as definitive. For finance, equity research, and competitive analysis teams where visual data drives decisions, Polyvia addresses a real gap that text-only document AI doesn't fill. For organizations with mostly text-based documents, simpler text-focused tools may be sufficient.
Key Features
Visual Knowledge Index.
Advanced Document Understanding.
VLM-OCR for Contextual Meaning.
One Source of Truth & Granular Disambiguation.
Frequently Asked Questions
Polyvia AI is a new platform. It helps computers understand visual information. This includes things like charts and diagrams from documents. It turns them into structured data that AI systems can use.
Instead of just looking at text, Polyvia AI extracts visual elements. It understands how these visuals connect across many documents. It creates a "knowledge graph" to link all extracted facts to their sources.
Polyvia AI uses special AI models (VLMs) and OCR. This helps it extract more than just visual content. It understands the context and relationships within charts and tables. This gives AI agents more valuable information.
Teams can use Polyvia Studio for visual search without coding. Developers can use APIs or MCP Server integrations. These connect Polyvia AI directly to their AI agents and existing systems.